Analytics of the manager's work
Published:
Analytics of the manager’s work includes two main indicators: efficiency and effectiveness of work. This is the average response time to customer requests and conversion by funnel.
Average response time
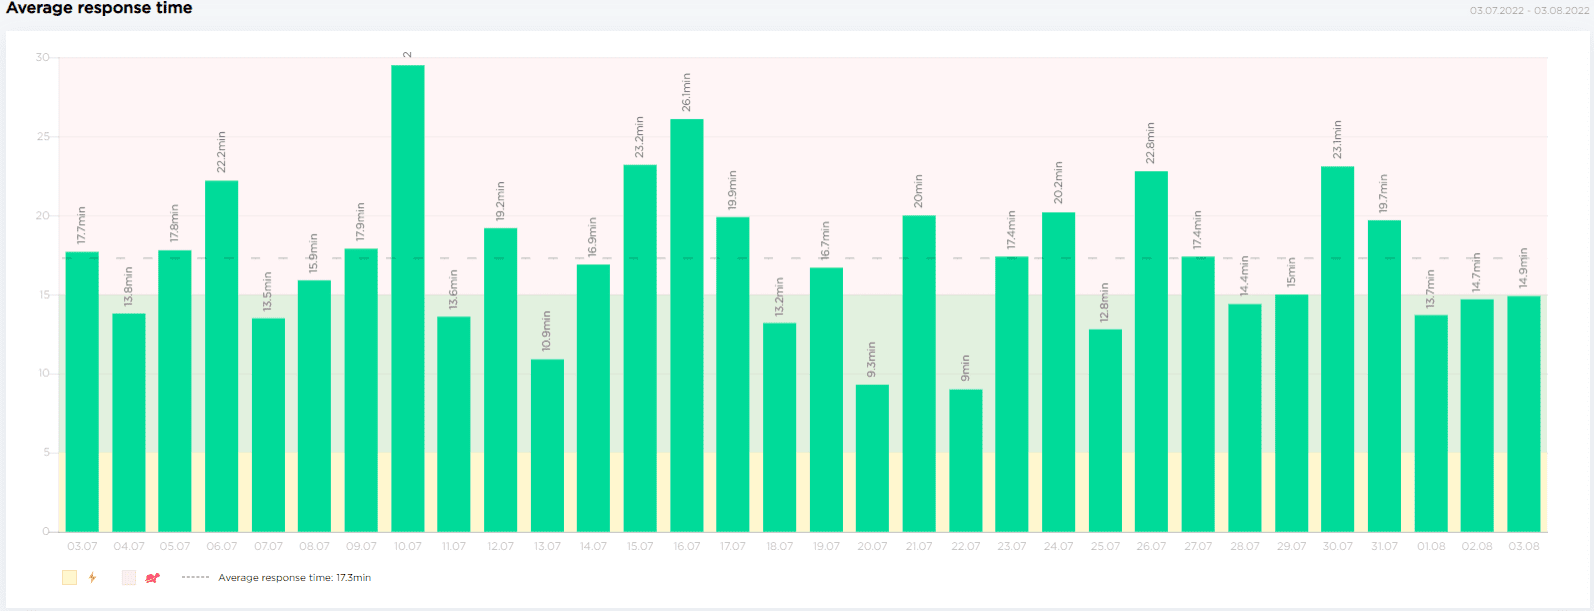
The Average Response Time graph shows the average time your employees have to respond to customer messages. “Average response time” is calculated on a daily basis.
The lightning icon indicates the time period of prompt responses, and the turtle icon, on the contrary, indicates the sluggishness of the employee.

Conversion
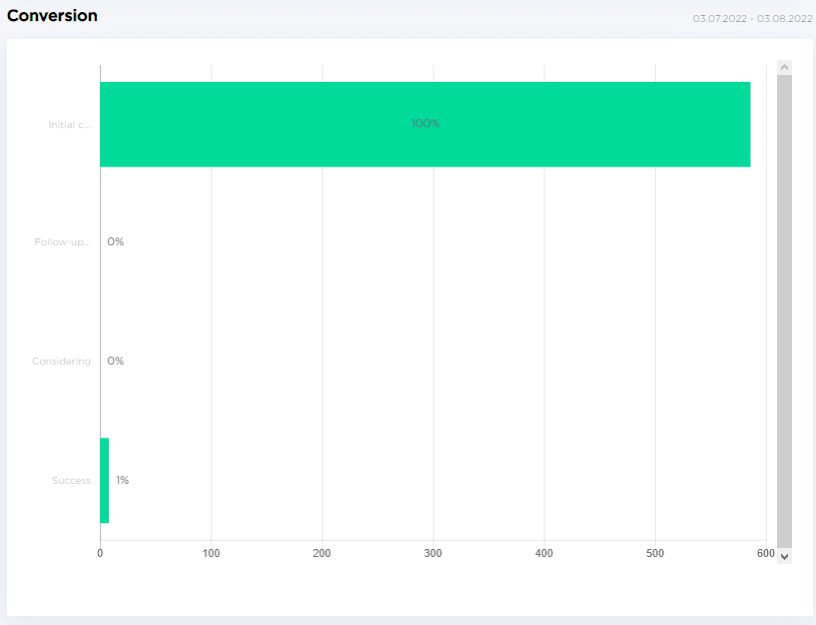
The “Conversion” graph illustrates the sales funnel, and also indicates the percentage of calls converted from status to status.

Should you still have any questions, please visit the “Help — Chat with the operator” section. We will be glad to assist.

 3-days free trial period