Company Analytics
Published:
This section of Umnico visually displays key performance indicators, including the number and sources of inquiries, the total bill and integration analysis.
Message sources
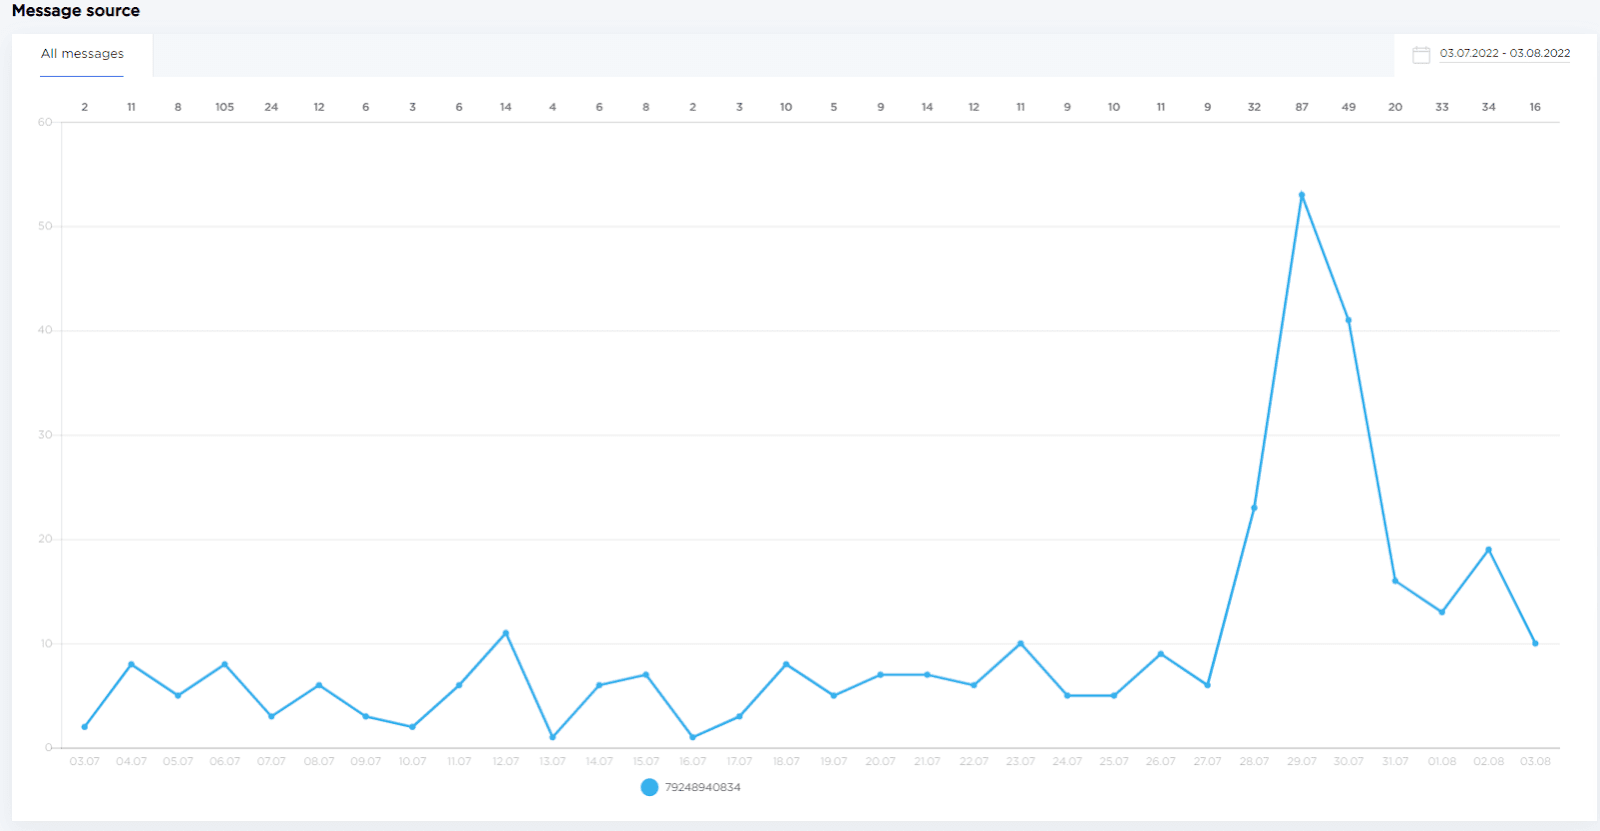
The graph “Message source” displays the number of new messages in the sections “New chats” and “My chats” per day. Messages sent to “spam” are not counted in this graph.

Total check
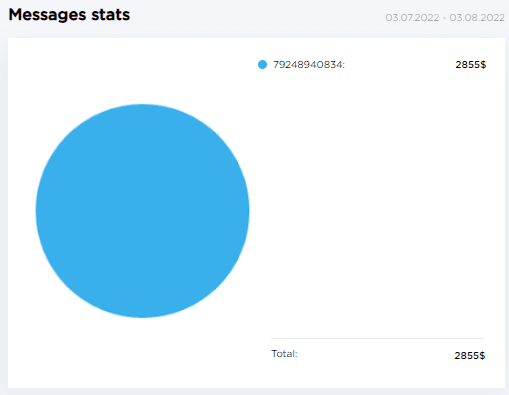
The “Total check” graph shows the ratio of the total monetary value of new requests in each integration on a chart, as well as their total cost.

Requests analysis
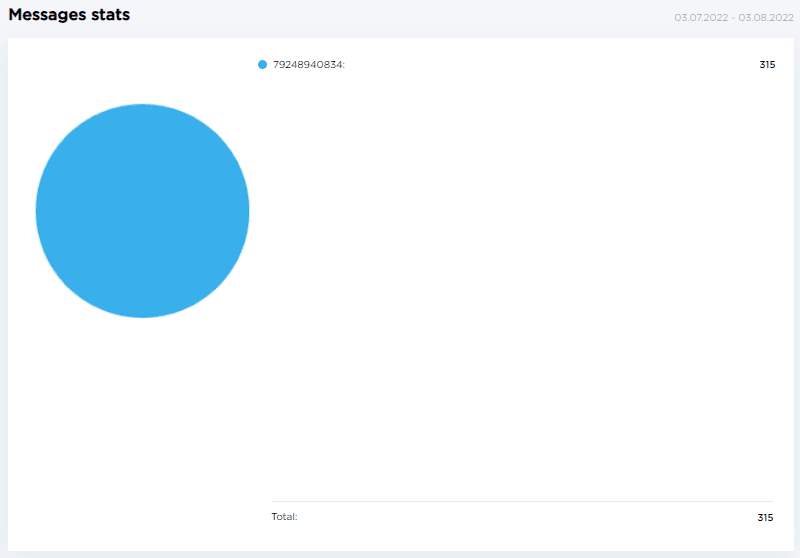
The “Requests Analysis” graph shows the ratio of new transactions by integrations and their total number.

Should you still have any questions, please visit the “Help — Chat with the operator” section. We will be glad to assist.

 3-days free trial period